Research Article | | Peer-Reviewed

Genotypic Variation for Phosphorus-use Efficiency Characteristics in Faba Bean (Vicia faba L.)

Published in Plant (Volume 13, Issue 3)
Received: 4 February 2025     Accepted: 22 May 2025     Published: 30 June 2025
Views:       Downloads:
Abstract

Developing phosphorus-use efficient faba bean (Vicia faba L.) genotypes is crucial for ensuring sustainable production in low phosphorus soils. The present study was conducted with the objective of identifying faba bean genotypes that use P efficiently. Twenty genotypes of faba bean in the field and 12 genotypes in the greenhouse were planted under two P fertilizer regimes (0 and recommended, 46 kg/ha). Withholding P fertilizer (0 kg/ha) application has significantly affected the performance of PUE traits; with decreasing effect ranging from 13.8% for grain yield (GY) to 38.6% for biomass phosphorus uptake (BPU) and increasing effect ranging from 5.9% for phosphorus harvest index (PHI) to 305.6% for PUE. Difference among the genotypes for most PUE traits were highly significant (P<0.01) under both P fertilizer regimes. Genotypes Moti, Gebelcho, and CS20DK in the field; Hachalu, Gebelcho and Dosha in the greenhouse, were efficient responder (ER) and had statistically higher mean for most PUE traits. Most traits including PUE had moderately high (60-79%) heritability. Biplot analysis showed that PUE, GY, BPU, and PUpE contributed the highest genetic divergence indicating their importance in breeding. Correlation analysis revealed that PUE was positively correlated to most traits including GY. It was shown that PUE and GY were strongly correlated to PUpE than they were to PUtE; suggesting that PUpE was more critical than PUtE for PUE variation. Findings of the study could be used to screen genotypes which have higher PUE and use them for breeding new cultivars better adapted to low P status soils.

Published in Plant (Volume 13, Issue 3)
DOI 10.11648/j.plant.20251303.11
Page(s) 108-123
Creative Commons

This is an Open Access article, distributed under the terms of the Creative Commons Attribution 4.0 International License (http://creativecommons.org/licenses/by/4.0/), which permits unrestricted use, distribution and reproduction in any medium or format, provided the original work is properly cited.

Copyright

Copyright © The Author(s), 2025. Published by Science Publishing Group

Keywords

Phosphorus (P), P Uptake and Utilization Efficiency, Faba Bean, Genotypes

1. Introduction
Faba bean (Vicia faba L.) is the fourth most important food legume in the world in terms of area of production, after field pea, chickpea, and lentil . Ethiopia is one of the top five leading producers and consumers of faba bean in the world . Its superior nutritional value compared to other grain legumes makes it a good source of protein for many people in Africa, Asia and Latin America, where animal protein is mostly unaffordable .
Phosphorus (P) plays an important role in nodule initiation, nitrogen fixation and other biochemical processes , and its deficiency often results in serious yield reduction . Soil phosphorus deficiency is a major constraint to faba bean production. It is a widespread problem in Ethiopia and other countries in Sub-Saharan Africa (SSA) . Farmers in SSA have limited resources and apply little or no P fertilizers , which is mainly due to continuous price increases in phosphorus fertilizer . For instance, Belachew et al. reported that only half of faba bean fields were fertilized in Ethiopia in 2019.
Vance et al., and McBeath et al. reported that even where P fertilizers are applied, 70-90% of the applied P is not available to crops due to fixation in the soil by Fe, Al, and Ca. There are also predicted concerns over the source of P to support agriculture in the future as the world’s reserve of phosphate rock could be depleted in the next few decades . Consequently, selection and development of P-efficient’ genotypes with greater ability to yield under P-deficient soil conditions should be an important plant breeding goal .
Production of P-efficient genotypes would reduce the production costs of P fertilization, minimize environmental pollution and contribute to maintenance of world P resources globally . The cultivation of P-efficient faba bean genotypes would be an important strategy for increasing soil fertility in traditional cropping systems through faba bean-cereal rotation. Phosphorus-use efficient (PUE) genotypes are reported to have higher grain yield due to high P uptake efficiency (PUpE) and/or high P utilization efficiency (PUtE) . P-efficient cultivars showed higher P uptake, dry matter, and grain yield in P-deficient soil via root foraging and P-mining strategies owing to the low mobility of P and relatively high P availability in surface soil layers . Thus, P-use efficient genotypes will contribute to agricultural sustainability by reducing the need to increase soil P status to achieve increased productivity and increasing the efficiency of use of applied P .
P-use efficiency has two major components: P uptake and utilization efficiency. P-uptake efficiency is the capacity of plants to uptake P from the soils while P is utilization efficiency is how efficiently the plants utilize the absorbed P . Therefore, different scientists have proposed different criteria of screening genotypes for P-use efficiency under P-deficient conditions, such as total P uptake , dry matter produced per unit of P applied , and the ratio of physiologically active P to total P uptake .
Significant variations in P-use efficiency have been reported among varieties of many crops including faba bean . Furthermore, achieving higher P efficiency is possible through a better understanding of the coordination of P uptake, transport, and remobilization in crops . Hence, screening P-efficient cultivars is very important to ensure sustainable production of the crop in P-deficient soils of Ethiopia. The present study was more comprehensive than similar studies previously conducted for faba bean in Ethiopia as it included higher number of genotypes, number of locations, experiments being conducted at both field and greenhouse and consideration of more number of PUE traits. Consequently, the present study was conducted with the objective of investigating the genotypic variation screening of faba bean genotypes for p-use efficiency.
2. Materials and Methods
2.1. Study Sites and Experimental Design
The study was carried out in 2015 and 2016 under field and greenhouse conditions. The field experiments were conducted under rain-fed condition at Adadi and Holetta, two faba bean growing areas in Ethiopia. The greenhouse experiment was conducted using the soil from Ambo, central Ethiopia. The geographical coordinates, climatic and soil physical and chemical properties of the sites used for the experiments are indicated in Table 1.
Table 1. General description of the study areas and their soil physico-chemical properties.

Parameters

Field

Greenhouse

Adadi

Holetta

Soil

Altitude (masl)

2520

2390

----

Latitude (N)

8.21

9.04

----

Longitude (E)

38.29

38.03

----

Temperature (°C)

8.5-23.5

6.4 -24.4

----

Rainfall (mm)

930.8

760.8

----

Soil type

Vertisol

Nitisol

Vertisol

Soil textural class

Clay

Clay

Clay

% Clay

61.18

46.42

66.58

% Silt

25.34

32.48

15.25

% Sand

12.54

20.17

15.45

pH (H20)

6.4

7.3

6.79

Available P (ppm)

15.94

23.67

19.92

Total N (%)

0.15

0.18

0.17

K (ppm)

37.35

25.79

31.56

Organic C (%)

1.16

0.738

1.17

CEC (Meq/100g)

25.13

23.05

18.17

EC (μS)

405.63

697.67

--

2.2. Plant Materials and Experimental Method
Twenty faba bean genotypes were used for the field experiments while twelve genotypes were used in the greenhouse. The genotypes included highly commercialized high yielding varieties and most promising breeding lines. The details of the germplasm are presented in Table 2. Seeds of these genotypes were obtained from Holetta Agricultural Research Center. Undamaged, clean and uniform sized seeds of each genotype were used. Soil samples were collected, before planting, from 0-30 cm depth at each location for analysis following the procedure described by . The experimental plots or pots were prepared in pairs in such a way that both are treated in the same way (being a mirror of each other) where one of the pair received phosphorus fertilizer (46 kg/ha P2O5) and the second was devoid (0) of the fertilizer. For the field experiment, plots consisted of single rows of 4 m length spaced 0.4 m apart, with seeds planted 0.1 m apart in each row. Two seeds were planted per hill and thinned to one at one week after planting to achieve a plant population of 250,000 plants/ha. For the greenhouse study, each pot (40 cm diameter) was filled with 5 kg of sterilized sand-soil mixture (2:1). Pots were watered to approximately 75% field capacity prior to planting. Four pre-germinated seeds were planted per pot and later thinned to three. Pots were watered daily till maturity. The experimental design was randomized complete block design (RCBD) in both experiments and each treatment was replicated three times.
Table 2. Description of the faba bean genotypes used in the study.

SN

Genotype

Pedigree

Year of Release

1000 seed weight

Altitude Range (masl)

Yield (t/ha)

Research Station

Farmer Field

1

Lalo

Selale Kasim 89-4

2002

325

2600-3000

3.6

--

2

Dagim

Girar Jarso 89-8

2002

299

2600-3000

3.5

--

3

CS20DK

CS20DK

1977

476

2300-3000

2.0-4.0

1.5-3.0

4

Obse

CS20DK x ILB4427

2007

821

1800-3001

2.5-6.1

2.1-3.5

5

Gebelcho

ILB4726 x Tesfa

2006

797

1800-3001

2.5-4.4

2.0-3.0

6

Holetta-2

BPL 1802-2

2000

506

2300-3000

2.0-5.0

1.5-3.5

7

Hachalu

EH00102-4-1

2010

890

1900-2800

3.2-4.5

2.4-3.5

8

Wayu

Wayu 89-5

2002

312

2100-2700

1.8-3.2

1.0-2.3

9

Selale

Selale Kasim 91-13

2002

346

2100-2700

2.2-3.3

1.0-2.3

10

Didea

EH01048-1

2014

700

1800-2800

3.5-4.6

2.0-4.4

11

Gora

EK01024-1-2

2013

980

1800-2800

3.0-5.0

2.0-4.0

12

Dosha

Coll 155/00-3

2009

704

1800-3000

2.8-6.2

2.3-3.9

13

Walki

Bulga-70 x ILB4615

2008

676

1900-2800

2.4-5.2

2.0-4.2

14

NC58

NC58

1978

449

1800-3000

2.0-4.0

1.5-3.5

15

Moti

ILB4432 x Kuse 2-27-33

2006

781

1800-3000

2.8-5.1

2.3-3.5

16

Tumsa

Tesfa x ILB 4726

2010

737

1800-3000

2.5-6.9

2.0-3.8

17

EH06088-1

Advanced breeding lines

--

--

--

--

--

18

EH07015-7

Advanced breeding lines

--

--

--

--

--

19

EH06022-4

Advanced breeding lines

--

--

--

--

--

20

EH06006-6

Advanced breeding lines

--

--

--

--

--

2.3. Data Collection
2.3.1. Phosphorus Use Efficiency Traits
1. Shoot and grain phosphorus (P) concentrations were estimated by the methods described by Chapman and Pratt (1961). Shoot and grain phosphorus concentrations were read on a spectrophotometer at absorbance values of 420 nm. A standard curve was constructed to calculate the shoot and grain P concentrations of the test genotypes.
2. Plant P uptake was calculated for shoot, grain and total biomass as follows: Shoot P uptake (SPU) = Shoot P concentration x Shoot dry weight; Grain P uptake (GPU) = Grain P concentration x Grain Yield; and Biomass P uptake, (BPU) = SPU + GPU.
3. Phosphorus-use efficiency (PUE) was calculated as P-utilization efficiency (PUtE) x P-uptake efficiency (PUpE) [32, 33]. PUtE was in turn calculated as Grain yield/P uptake. PUpE was estimated as P-uptake/ available P. Available P was estimated as the sum of P availability at sowing and P from fertilization.
4. Phosphorus harvest index (PHI,%), was calculated as (GPU/ BPU) x 100.
5. Apparent P-fertilizer recovery (APFR,%) was calculated as [(BPU+ - BPU-)/ P applied] x100, where BPU+ and BPU- are biomass phosphorus uptake under P fertilized and unfertilized trial respectively.
6. Phosphorus Agronomic efficiency (PAE) was calculated as (GY+ - GY-)/ P applied to treated plants, where GY+ and GY-; are grain yield under P fertilized and unfertilized trial respectively.
7. Phosphorus Physiological efficiency (PPE,%) was computed as (GY+ - GY-)/ (BPU+ - BPU-) x 100.
8. Phosphorus efficiency ratio (PER,%) was calculated as the ratio of shoot dry matter weight under low soil P to shoot dry matter weight under adequate P supply; (SDW-/ SDW+) x 100 .
9. Shoot dry weight (SDW) and grain yield (GY, g/plant) were estimated from five plants per plot and three plants per pot for field and greenhouse experiments, respectively.
10. Relative reduction (RR,%) of trait’s performance under P unfertilized trial as compared to their performance under P-fertilized trial is calculated as; RR = 1- (performance of trait under P unfertilized / performance of trait under P fertilized trial) x 100. It is used to evaluate the sensitivity of the traits to reduced phosphorus amount in the soil.
2.3.2. Classification of Genotypes into Phosphorus-use Efficiency Groups
The genotypes were classified into phosphorus-use efficiency groups based on grain yield and phosphorus utilization efficiency. Using both traits as a means of categorization, four phosphorus efficiency classes are obtained viz. (i) inefficient, non-responder (INR); (ii) efficient, non- responder (ENR); (iii) inefficient, responder (IR); and (iv) efficient, responder (ER). In this method, an efficient genotype performs better than the mean performance of other genotypes under low phosphorus; while a responder genotype performs better than the mean performance of other genotypes under high phosphorus. INR genotypes perform lower than the mean performance of other genotypes under low and high phosphorus, respectively.
2.4. Data Analysis
Data were checked for homogeneity of variance and transformed, where applicable, before statistical analysis. An individual site and combined analysis of variance were performed using SAS 9.3 . Variance components were calculated using mixed models;
ρijk= µ+ gi+lj +(gl)ij +(r/l)jk+eijk (1)
Where ρijk = phenotypic observation on variety i in replicate k at location j (i = 1...g, j = 1...L, and k = 1...r) and g, l and r = number of genotypes, locations and replications, respectively, µ = grand mean, gi = the effect of genotype i, lj = the effect of location j, (gl)ij = the interaction effect between genotype and location, (r/l)jk = the effect of replicate k within location j and eijk = error. Multiple mean comparisons were performed using Duncan’s New Multiple Range Test at 0.05 level of probability. Genetic relationships among individuals were assessed by multivariate principal component analysis (PCA) and Genotype by trait (GT) biplot using Minitab19 software. Relative reduction (RR) of the agronomic performance of the genotypes on phosphorus untreated plot relative to their performance on phosphorus treated plot was calculated as, RR = 1- (performance without P/ performance with P). Broad sense heritability (h2) was calculated as: h2 = σ2g / [σ2g +σ2gl/L+σ2e / (RL)]; where σ2p, σ2g, σ2gl, and σ2e are phenotypic, genotypic, genotype by location interaction, and error variances, respectively. L = number of locations, R = number of replications. Pearson’s correlation coefficients were estimated using the PROC CANCORR subprogram of SAS.
3. Results
3.1. Effect of Phosphorus Application Levels on the Phosphorus Use Efficiency Traits
Mean performance of the phosphorus use efficiency traits under P-fertilized and P-unfertilized treatments in the field and greenhouse and their relative reductions are presented in Table 3. In both the field and greenhouse conditions, the mean performances of the traits were significantly affected (positively and negatively) by the level of P application.
In the field, traits which were negatively affected by withholding P fertilizer were shoot P concentration (SP), grain phosphorus concentration (GP) and biomass phosphorus uptake (BPU) and were reduced by 28.5, 27.9, and 36.6%, respectively. In contrary, mean values of phosphorus harvest index (PHI), phosphorus utilization efficiency (PUtE), phosphorus uptake efficiency (PUpE), and phosphorus use efficiency (PUE) were lower on P-fertilized than on P-unfertilized treatment with respective RR of -5.9, -34.9, -101.5 and -175.0%. Similar trends of the effect of P fertilization levels on the performances of the traits were observed for the greenhouse experiment. Three traits viz. SP, GP and BPU under P-fertilized were increased compared to P-unfertilized treatment by 25.3, 17.6, and 37.3% respectively, PHI, PUtE, PUpE and PUE under P-fertilized compared to P-unfertilized treatment were reduced by 6.5, 29.2, 223.5 and 305.6% respectively (Table 3).
3.2. Effect of Genotypes on the Performance of Phosphorus Use Efficiency Traits
The faba bean genotypes were highly significantly (P<0.05) different for plant (shoot and grain) phosphorus concentration, on all experimental variants, except for grain phosphorus concentration under P-unfertilized trials (Table 3). In the field, shoot phosphorus concentration (in g/kg) of genotypes was highest for Hachalu, Tumsa, Didea, Dosha and Moti under the phosphorus fertilized trial; and EH06022-4, Walki, Hachalu, Dosha and Moti under the P-unfertilized trial. Grain phosphorus concentration (in g/kg) of the genotypes ranged from 3.93 for Walki to 4.50 for Didea for phosphorus fertilized field trial; and the value of the trait ranged from 2.87 for Walki to 3.12 for Dagim for the P unfertilized field trial (Table 4). In the greenhouse, Moti, Walki and ILB4358 had the highest shoot phosphorus for the P fertilized trial; while Tumsa, Moti and Walki were the top performers for the P-unfertilized trial. Selale, Didea, and Obse with 3.49, 3.47 and 3.40 g/kg, respectively, had the highest grain phosphorus concentration (Table 5).
Highly significant (P<0.05) variation was observed among genotypes performance for biomass phosphorus uptake (BPU, mg/plant) (Table 3). It ranged from 101.3 mg/plant for EH06088-1 to 126.6 mg/plant for Hachalu under P-fertilized field; while it ranged from 61.6 EH06088-1 to 78.5 mg/plant for Moti under P unfertilized field trial (Figure 1). Genotypes Hachalu, Didea, Dosha, Tumsa, and Moti under P-fertilized field trial; Moti, Dosha, Walki, Tumsa and Hachalu under P-unfertilized field trial had the highest amount of BPU. For the greenhouse trial, Hachalu, Dosha and Moti were the best performing genotypes; under both fertilized and unfertilized trial. Averaged over genotypes, BPU in the field was 1.3 times more than the value obtained in the greenhouse owing to the higher plant P concentration, grain yield and shoot dry weight of the genotypes in the field.
Phosphorus harvest index (PHI) (proportion of P exported via grains) of the faba bean genotypes was significantly different (p<0.05) from one another, under P-fertilized field and -unfertilized greenhouse trials (Table 3). In the field, EH06088-1, Lalo and CS20DK had the highest PHI under P-fertilized treatment, while EH06088-1, Lalo and Holetta-2 were the genotypes with the highest PHI under P-unfertilized treatment (Table 4). In the greenhouse condition, genotypes Moti, Dosha and Gebelcho had the highest PHI under both P-fertilized and P-unfertilized treatments (Table 5).
The tested faba bean genotypes were highly significantly (P<0.05) different from one another in their phosphorus utilization efficiency (PUtE) performance, except for the unfertilized field trial (Table 3). EH06088-1, Lalo, Gebelcho, and CS20DK were the top performing genotypes for fertilized field trial (Table 4). Gebelcho, Dosha, and Moti were the best performing genotypes under P fertilized and unfertilized greenhouse trial, respectively, as appeared in the bracket (Table 5). The PUtE performance of the genotypes was higher for phosphorus unfertilized than fertilized trial; and was higher at greenhouse than field (Table 3).
Analysis of variance showed that highly significant (P< 0.05) variation was observed among faba bean genotypes for phosphorus uptake efficiency (PUpE) performance; at both field and greenhouse under both P fertilizer levels (Table 3). Hachalu, Didea, Dosha, Gebelcho and Moti, under P fertilized trial; Moti, Tumsa, Dosha, Walki and Hachalu under P unfertilized trial, were the best performing genotypes for PUpE. At greenhouse, Hachalu, Didea, Dosha and Moti were the best performing genotypes for the trait (Table 4).
Phosphorus use efficiency (PUE) performance of the faba bean genotypes was highly significantly varied for all variants of the treatments (Table 3). PUE of the genotypes ranged from 47 for Selale to 53.68 for Gebelcho under P fertilized field; while it ranged from 129.24 for EH06088-1 to 151.23 for Moti under P unfertilized field. Gebelcho, Hachalu, Dosha, Moti and CS20DK, under P fertilized field trial; Moti, Dosha, Gebelcho, Walki and Tumsa under P unfertilized trial were PUE efficient genotypes. At greenhouse condition, Moti, Dosha, Hachalu and Gebelcho had higher PUE, under both fertilized and unfertilized trials (Figure 1).
PUE performance of the genotypes was by far greater on P unfertilized than P fertilized trial. To put it more clearly, mean PUE performance on unfertilized field was 2.75 times the performance on fertilized field; while it was 4 times, on average, greater with unfertilized greenhouse than fertilized greenhouse trial. This is mostly due to reduction in the amount of total available phosphorus, which is a denominator term in the estimation of PUE, for unfertilized trial which ultimately yielded higher PUE values. Likewise, the faba bean genotypes had higher PUE at Holetta than Adadi. This is due to higher PUtE performance observed at Holetta than Adadi. Genotypes performance of PUE at Greenhouse was also higher than that at field, which is most probably attributed for high PUtE values associated with greenhouse trials.
Table 3. Mean, relative reduction (RR) and mean squares of the phosphorus use efficiency traits.

Trait

Field

Greenhouse

Mean

RR (%)

MSG

MSGL

h2 (%)

CV (%)

Mean

RR (%)

MSG

h2 (%)

CV (%)

With Phosphorus

SP (g/kg)

3.20

---

0.11**

0.035ns

68.5

8.5

2.72

---

0.03**

78.5

4.5

GP (g/kg)

4.12

---

0.11**

0.003ns

75.0

5.3

3.32

---

0.04**

78.7

4.2

BPU (mg/p)

114.7

---

0.00**

0.001ns

79.6

17.1

85.2

---

0.00**

80.2

5.3

PHI (%)

46.9

---

18.20**

3.87ns

78.1

12.1

50.6

---

13.89**

71.7

5.8

PUtE (g/g)

143.6

---

155.82*

35.36ns

70.9

15.9

152.7

---

249.1**

82.2

6.8

PUpE (g/g)

0.36

---

0.00**

0.000ns

83.0

14.9

0.34

---

0.00**

79.1

5.3

PUE (g/g)

50.0

---

20.77**

7.29ns

64.9

5.8

52.1

---

54.35**

84.6

8.8

PAE (%)

10.1

---

21.68**

23.71**

11.2

24.6

12.3

---

8.56ns

39.3

18.7

PPE (%)

55.5

---

377.30*

471.4*

18.3

28.9

77.6

---

394.36*

62.7

19.6

APFR (%)

19.1

---

22.09**

8.78*

60.2

25.2

15.9

---

3.64ns

47.1

9.9

GY (g/p)

14.6

---

1.752**

0.620**

64.5

5.7

12.6

---

1.318***

78.8

6.7

Trait

Without Phosphorus

SP (g/kg)

2.29

28.5

0.05*

0.009ns

77.1

9.3

2.03

25.3

0.03**

77.9

5.7

GP (g/kg)

2.97

27.9

0.04ns

0.019ns

74.7

6.5

2.73

17.6

0.01ns

67.2

3.1

BPU (mg/p)

70.5

38.6

0.00**

0.000ns

78.8

14.8

53.4

37.2

0.00**

76.8

5.8

PHI (%)

49.7

-5.9

21.87*

10.04ns

60.0

9.2

53.9

-6.5

19.58**

64.6

5.7

PUtE (g/g)

193.7

-34.9

258.3ns

69.38ns

63.3

13.0

197.3

-29.2

393.2**

76.6

6.7

PUpE (g/g)

0.72

-101.2

0.01**

0.001ns

84.1

9.0

1.07

-223.5

0.01**

87.3

5.8

PUE (g/g)

137.6

-175.2

159.5**

59.84ns

62.5

8.2

211.2

-305.6

1132.0*

82.8

9.8

GY (g/p)

13.0

13.8

1.351**

0.399*

70.5

5.9

10.6

18.9

1.017**

76.7

7.0

Note: SP, Shoot phosphorus concentration; GP, Grain phosphorus concentration; BPU, Biomass phosphorus uptake; PHI, Phosphorus Harvest Index; PUtE, Phosphorus utilization efficiency; PUpE, Phosphorus uptake efficiency, PUE, Phosphorus use efficiency; PAE, Phosphorus agronomic efficiency; PPE, Phosphorus physiological efficiency; APFR, Apparent phosphorus fertilizer recovery; GY, Grain yield; h2, heritability; CV, coefficient of variation.
Grain yield (GY, g/plant) of the genotypes, at field, ranged from 13.7 g/plant for Selale to 15.7 g/plant for Gebelcho under P-fertilized trial; while it ranged from 11.8 g/plant for EH06088-1 to 13.8 g/plant for Moti under P-fertilized trial (Table 4). In the greenhouse, under both P levels, the highest GWP was observed for Moti (14.6 and 11.9 g/plant); while it was lowest for Tumsa (11.4 and 9.2 g/plant) (Table 5). Among the genotypes, Moti and Dosha showed consistently higher GY at both field and in the greenhouse under the two P levels; indicating the stability of the genotypes across different environmental conditions.
As shown in figure 2, grain yield and phosphorus use efficiency of the genotypes showed a very strong collinearity for all test conditions. This was also observed in the biplot (figure 3) which showed highly strong and positive correlation between the two traits. Accordingly, Gebelcho, Hachalu, Moti, Dosha, Holetta-2 and Walki had the highest GY and PUE under both P levels at field; while Wayu, Holetta-2, Didea, Dagim, Gebelcho, and Obse had the highest GY and PUE under both P levels at greenhouse (Figure 3).
The performance of the genotypes with respect to apparent phosphorus fertilizer recovery (APFR) was highly significantly (P< 0.05) different for the field trial, but not for the greenhouse trial (Table 3). The highest APFR was recorded for Hachalu, Didea, Wayu and Gebelcho. APFR of the genotypes at Adadi was highest for Hachalu and Wayu; while genotypes Didea and Wayu performed best at Holetta (Table 6). Generally, the APFR performance of the genotypes was better at Adadi than at Holetta.
Phosphorus agronomic efficiency (PAE) indicates the ability of plants to use P fertilizer to produce grain yield. For field experiment, genotypes were highly significantly (P< 0.001) varied for PAE; whereas there was no significant variation among genotypes for greenhouse experiment (Table 3). Hachalu and Gebelcho out-performed other genotypes with PAE value of 15.55 and 13.51%, respectively. Genotype Hachalu followed by Gebelcho were the best performing genotypes with respect to Phosphorus agronomic efficiency at Adadi; while Hachalu and Didea were the best performing genotypes at Holetta. However, genotypes had comparable performance of PAE at both Holetta and Adadi (Table 6).
Analysis of variance showed that there was highly significant variation among genotypes for phosphorus physiological efficiency (PPE), at both field and greenhouse (Table 3). At field condition, Hachalu and EH06088-1 with 72.36% and 72.28% respectively were the highest performing genotypes for PPE. Hachalu and EH06022 were the highest performing genotypes for PPE at Holetta. Performance for the parameter at Adadi was highest for EH06088-1 and Gebelcho (Table 6). Generally, PPE performance of the genotypes was higher at Holetta than at Adadi; because biomass phosphorus uptake was higher at Adadi than at Holetta. For greenhouse trial, Walki, Wayu and Obse genotypes had the highest PPE value.
3.3. Heritability of the Phosphorus Use Efficiency Traits
In the field, heritability values of the phosphorus use efficiency traits ranged from 11.2% for phosphorus agronomic efficiency (PAE) to 83.0% for phosphorus uptake efficiency (PUpE) for the P-fertilized treatment, while the heritability for P-unfertilized treatment ranged from 60.0% for phosphorus harvest index (PHI) to 84.1% for PUpE (Table 6). For P fertilized treatment in the greenhouse, heritability of the traits ranged from 39.3% for PAE to 84.6% for PUE, while the range was from 64.6% for PUtE to 87.28% for PUpE for P- unfertilized treatment (Table 6).
On the basis of the criteria provided by Singh, (2000), in both field and greenhouse, only few traits had very high (≥80%) heritability (PUpE on P+ and P- in the field; PUtE and PUE on P+ and P- in the greenhouse; BPU on P+ in the greenhouse) and low (<40%) heritability (PAE in both field and greenhouse, and PPE in the field). Most PUE traits were found to have comparable values of heritability in the field and greenhouse, indicating repeatability of the results.
Table 4. Plant phosphorus concentrations and PUE characteristics of faba bean genotypes on P fertilized and unfertilized field trial.

Genotypes

With Phosphorus

Without Phosphorus

SP (g/kg)

GP (g/kg)

PHI (%)

PUtE (g/g)

PUpE (g/g)

GY (g/p)

SP (g/kg)

GP (g/kg)

PHI (%)

PUtE (g/g)

PUpE (g/g)

GY (g/p)

Lalo

3.09b-d

3.98cd

49.15ab

150.88ab

0.33ef

14.3b-e

2.05c

2.91a

53.26a

207.81a

0.65ef

12.25b-d

Dagim

3.20bc

4.37ab

47.60bc

139.81a-c

0.36a-e

14.5a-e

2.25a-c

3.12a

50.47a

190.33ab

0.73a-e

12.53b-d

EH06088-1

2.84d

4.11b-d

53.01a

156.52a

0.32f

14.2c-e

2.09bc

2.94a

54.12a

203.42ab

0.64f

11.80d

CS20DK

3.02cd

4.14b-d

48.78a-c

147.57a-c

0.35b-f

14.8a-e

2.27a-c

2.95a

50.45a

197.84ab

0.70b-f

12.64b-d

Obse

3.21bc

4.15b-d

47.76a-c

144.24a-c

0.36b-e

14.7a-e

2.29a-c

2.98a

48.91a

188.69ab

0.72a-e

12.37b-d

Gebelcho

3.09b-d

4.07b-d

47.06bc

150.59ab

0.37a-d

15.7a

2.23a-c

2.96a

49.53a

200.30ab

0.72a-f

12.96a-d

Holetta-2

3.13b-d

3.96c-d

46.97bc

148.39a-c

0.34c-f

14.7a-e

2.25a-c

2.93a

52.44a

203.91ab

0.69b-e

12.64b-d

Hachalu

3.56a

4.06b-d

44.46bc

139.89a-c

0.40a

15.6ab

2.40a-c

2.98a

47.80a

184.50ab

0.75a-d

12.53b-d

Wayu

3.26a-c

4.15b-d

46.35bc

138.98bc

0.36a-e

14.3a-e

2.27a-c

2.89a

50.83a

197.76ab

0.67d-f

11.99cd

Selale

3.12b-d

4.06b-d

47.67bc

144.56a-c

0.33d-f

13.7e

2.25a-c

2.96a

51.94a

197.27ab

0.70b-f

12.49b-d

Didea

3.33ab

4.50a

46.62bc

132.33c

0.39ab

14.6a-e

2.32a-c

2.92a

47.52a

190.45ab

0.74a-d

12.77a-d

Gora

3.09b-d

4.10b-d

46.25bc

144.69a-c

0.35b-f

14.4a-e

2.23a-c

2.96a

47.57a

192.09ab

0.74a-d

12.86a-d

Dosha

3.32a-c

4.13b-d

45.20bc

141.63a-c

0.38a-c

15.2a-d

2.38a-c

2.99a

47.65a

191.41ab

0.77ab

13.27ab

EH07015-7

3.14b-d

4.19a-d

47.26bc

138.39bc

0.36a-e

14.3a-e

2.30a-c

2.98a

48.37a

188.34ab

0.72a-e

12.49b-d

EH06022-4

3.14b-d

4.14b-d

46.85bc

140.55a-c

0.34c-f

13.8de

2.44a

3.09a

48.39a

177.57b

0.74a-d

12.01cd

Walki

3.27a-c

3.93d

43.80c

142.82a-c

0.36a-e

14.8a-e

2.43ab

2.87a

46.62a

189.58ab

0.76a-c

13.03a-c

NC58

3.32a-c

4.05cd

47.64bc

143.84a-c

0.35b-f

14.1c-e

2.24a-c

2.90a

51.62a

198.47ab

0.68c-f

12.27b-d

Moti

3.32a-c

3.99cd

44.13bc

144.79a-c

0.37a-c

15.4a-c

2.38a-c

3.00a

48.53a

193.74ab

0.79a

13.84a

Tumsa

3.37ab

4.26a-c

45.54bc

137.83bc

0.37a-c

14.7a-e

2.36a-c

3.14a

48.99a

185.99ab

0.77ab

12.87a-d

EH06006-6

3.23a-c

4.00cd

45.94bc

141.89a-c

0.35b-f

14.1c-e

2.37a-c

2.84a

48.04a

194.06ab

0.70b-f

12.23b-d

Mean

3.20

4.12

46.94

143.61

0.36

14.6

2.29

2.96

49.65

193.68

0.72

12.6

CV

11.21

8.15

12.55

9.47

8.75

7.21

9.34

6.5

9.22

13.01

9.03

5.89

Means followed by different letters within a column are significantly different at P < 0.05.
SP, Shoot phosphorus concentration; GP, Grain phosphorus concentration; PHI, Phosphorus Harvest Index; PUtE, Phosphorus utilization efficiency; PUpE, Phosphorus uptake efficiency, GY, Grain yield.
Table 5. Plant phosphorus concentration and PUE characteristics of the genotypes on P fertilized and unfertilized greenhouse trial.

Genotypes

With Phosphorus

Without Phosphorus

SP (g/kg)

GP (g/kg)

PHI (%)

PUtE (g/g)

PUpE (g/g)

GY (g/p)

SP (g/kg)

GP (g/kg)

PHI (%)

PUtE (g/g)

PUpE (g/g)

GY (g/p)

Obse

2.70ab

3.40ab

51.98a

152.78a-c

0.33ab

12.7c

2.02a-c

2.74a

53.61a-c

196.08a-c

1.00bc

9.8cd

Hachalu

2.67ab

3.38a-c

51.83a

153.29a-c

0.36a

13.9ab

2.03a-c

2.83a

55.90a-c

197.98a-c

1.16a

11.5ab

ILB4358

2.81ab

3.31a-c

48.04a

145.33bc

0.34ab

12.4cd

1.98bc

2.71a

53.00a-c

195.64a-c

1.07a-c

10.5bc

Selale

2.70ab

3.49a

47.59a

136.40c

0.34ab

11.4de

2.06a-c

2.77a

50.97bc

184.08c

1.04a-c

9.6de

Didea

2.77ab

3.47a

52.02a

150.20a-c

0.35ab

13.3bc

2.04ac

2.77a

53.45a-c

193.23a-c

1.12ab

10.8bc

Gora

2.66ab

3.27a-c

50.58a

154.77a-c

0.35ab

13.4b

1.92bc

2.76a

55.03a-c

199.81a-c

1.06a-c

10.6bc

Dosha

2.67ab

3.23a-c

52.73a

163.25a

0.35ab

14.4a

1.95bc

2.69a

56.62a-c

213.76ab

1.12ab

11.8a

Walki

2.82a

3.27a-c

49.96a

152.68a-c

0.32b

12.3c-e

2.10a-c

2.76a

50.92bc

184.59c

1.01bc

9.4de

Moti

2.86a

3.35a-c

53.43a

159.40ab

0.37a

14.6a

2.15ab

2.71a

57.97a

210.75ab

1.12ab

12.0a

Tumsa

2.79ab

3.37a-c

47.17a

140.09bc

0.32b

11.4e

2.23a

2.72a

50.44c

185.18c

0.99c

9.2e

Gebelcho

2.52b

3.10c

52.45a

168.79a

0.33b

13.8ab

1.88c

2.61a

56.76ab

217.52a

1.06a-c

11.6ab

Wayu

2.67ab

3.17bc

49.27a

155.58a-c

0.33b

12.6c

2.00ac

2.75a

51.95a-c

188.88bc

1.08a-c

10.2cd

Mean

2.72

3.32

50.59

152.71

0.34

13.01

2.03

2.73

53.89

197.29

1.07

10.55

CV

5.71

3.13

4.34

4.85

5.68

6.97

4.45

4.17

3.81

5.21

5.42

6.67

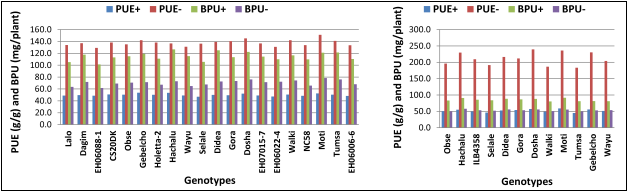
Figure 1. PUE and BPU of the genotypes under P fertilized (+) and unfertilized (-) field (left) and greenhouse (right) conditions.
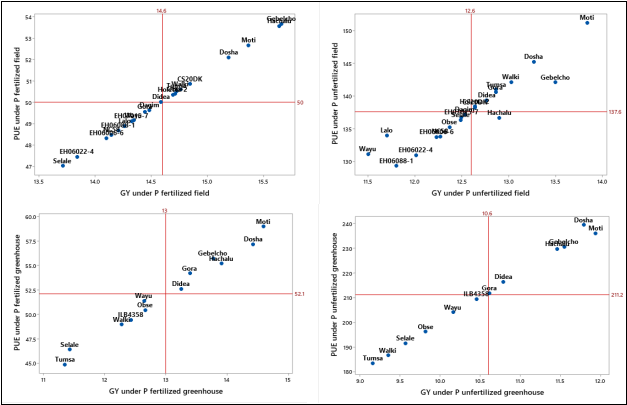
Figure 2. Performance of the genotypes for grain yield (GY) and phosphorus use efficiency (PUE) under P fertilized and unfertilized field and greenhouse conditions.
Table 6. Phosphorus efficiency characteristics of the genotypes in the field.

Genotypes

APFR (%)

PAE (%)

PPE (%)

Holetta

Adadi

Mean

Holetta

Adadi

Mean

Holetta

Adadi

Mean

Lalo

14.65i-k

21.30b-g

18.32b-d

8.92b-i

11.26a-f

10.09b-d

60.90a-f

51.09c-h

55.99a-c

Dagim

15.52f-k

23.15b-e

19.34a-d

8.23c-i

11.28a-f

9.75c-e

53.51b-g

49.06c-h

51.28a-c

EH06088-1

12.50k

21.70b-h

17.10d

9.61b-h

14.44ab

12.02a-c

77.60a-c

66.96a-e

72.28a

CS20DK

14.18i-k

23.79a-d

18.98a-d

8.76b-i

13.30a-c

11.03b-d

63.38a-e

56.22b-g

59.80a-c

Obse

14.03i-k

24.14a-c

19.08a-d

10.19a-g

13.23a-c

11.71bc

73.96a-c

54.38b-g

64.17ab

Gebelcho

15.97f-k

24.70a-c

20.33a-d

11.52a-f

15.49a

13.51ab

71.93a-c

63.80a-e

67.86a

Holetta-2

15.30g-k

22.38b-f

18.84b-d

8.93b-i

11.59a-f

10.26b-d

58.65a-f

52.86c-h

55.75a-c

Hachalu

16.69e-k

30.13a

23.41a

15.47a

15.63a

15.55a

92.97a

51.76c-h

72.36a

Wayu

16.92d-k

27.22ab

22.07a-c

11.20a-g

12.37a-d

11.78bc

66.24a-e

45.80c-h

56.03a-c

Selale

13.95j-k

18.55c-k

16.25d

8.76b-i

3.49i

6.10e

62.71a-e

18.45h

40.58c

Didea

18.41c-k

26.59ab

22.50ab

12.03a-e

6.17f-i

9.10c-e

65.79a-e

23.16gh

44.47bc

Gora

14.80h-k

19.26c-k

17.03d

11.52a-f

4.30h-i

7.91de

79.63a-c

22.19gh

50.91a-c

Dosha

15.79f-k

23.97a-c

19.88a-d

11.01a-g

8.22c-i

9.61c-e

70.38a-d

34.28ef

52.33a-c

EH07015-7

14.57i-k

24.12a-c

19.35a-d

10.28a-g

8.01c-i

9.14c-e

70.53a-d

33.16e-h

51.81a-c

EH06022-4

14.00i-k

18.07c-k

16.04d

12.03a-e

6.24e-i

9.14c-e

88.05ab

33.83e-h

60.94a-c

Walki

15.48f-k

20.57b-j

18.03cd

11.96a-f

5.37g-i

8.66c-e

77.56a-c

26.35f-h

51.96a-c

NC58

14.39i-k

24.426ac

19.40a-d

10.64a-g

8.11c-i

9.38c-e

75.11a-c

33.34e-h

54.23a-c

Moti

14.84h-k

20.92bi

17.88cd

8.30c-i

6.98d-i

7.64de

55.42b-g

33.53e-h

44.48bc

Tumsa

16.63e-k

21.97bg

19.30a-d

10.62a-g

7.97c-i

9.30c-e

64.60a-e

36.63d-h

50.62a-c

EH06006-6

15.17g-k

22.02bg

18.60b-d

8.82b-i

9.88a-h

9.35c-e

58.80a-f

45.21c-h

52.00a-c

Means followed by different letters within a column are significantly different at P < 0.05.
APFR, Apparent phosphorus fertilizer recovery; PAE, Phosphorus agronomic efficiency; PPE, Phosphorus physiological efficiency.
3.4. Grouping of the Genotypes into Phosphorus Efficiency Classes
Based on the grain yield and phosphorus utilization efficiency classification methods, the genotypes were categorized under four phosphorus efficiency classes; namely ER (efficient, responder), INR (inefficient, non-responder), ENR (efficient, non-responder) and IR (inefficient, responder) (Figure 3). Efficient and responsive (ER) are plants that produce above average biomass at lower nutrient concentrations and respond to nutrient addition. Inefficient and non-responsive (INR) are plants that produce less than average biomass at lower nutrient concentrations, and which do not respond to nutrient addition. Efficient and non-responsive (ENR) are plants that produce above average biomass at lower nutrient concentrations, but do not respond to the addition of nutrients. Inefficient and responsive (IR) are plants that produce less than average biomass at lower nutrient concentrations but still respond to nutrient addition.
As shown in Figure 3, under both field and greenhouse conditions, most genotypes fall under either ER (efficient, responder) or INR (inefficient, non-responder); while there were very few to no genotypes grouped under both ENR (efficient, non-responder) and IR (inefficient, responder) efficient classes. Nine genotypes each were categorized under INR and ER classes for both grain yield and phosphorus utilization efficiency; at field trial. At greenhouse, six INR and five ER genotypes were grouped for grain yield; while five INR and six ER categories of genotypes were identified for phosphorus utilization efficiency. This indicated that majority of the genotypes exhibited similar responses to different levels of phosphorus fertilizer application.
Under field condition, Moti, Gebelcho, Hachalu, Dosha and Walki were the genotypes grouped under ER efficiency class based on the grain yield categorization scheme; while EH06088-1, Lalo, Holetta-2, Gebelcho and CS20DK are grouped under ER based on the phosphorus utilization efficiency categorization scheme. In the greenhouse, Moti, Dosha, Hachalu, Gebelcho and Didea under the grain yield categorization scheme and Gebelcho, Gora, Dosha, Wayu and Didea under the phosphorus utilization efficiency categorization scheme, were categorized under ER efficiency class. Only one genotype (Selale) have fallen under INR class for the grain yield categorization scheme; while six genotypes, including Selale, Tumsa, ILB4358, Wayu, Walki and Obse, were categorized under INR for the phosphorus utilization efficiency categorization scheme in the greenhouse condition.
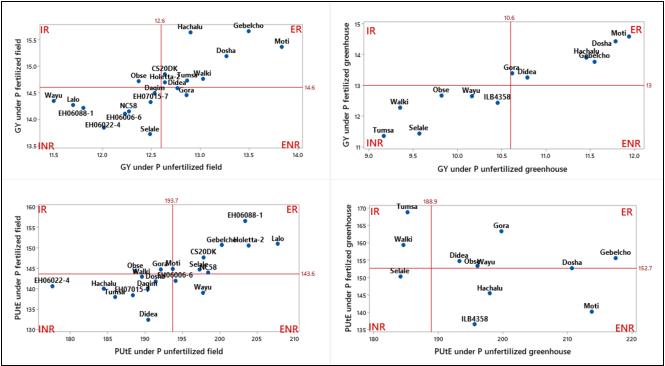
Figure 3. Phosphorus efficiency classes of the genotypes based on grain yield (GY) and phosphorus utilization efficiency (PUtE) at field and greenhouse. Note: IR, inefficient inefficient; ER, efficient responder; INR, inefficient non-responder; ENR, efficient responder.
3.5. Biplot Analysis and Trait Relationships
Genotype by trait (GT) biplot analysis showed that the first two principal components accounted for 71.1 and 84.0% variation under P-fertilized and P-unfertilized trials, respectively (Figure 4). The result displayed in the GT biplot is interpreted based on the principles described in . Accordingly, under both P levels, shoot phosphorus concentration (ShootP), total phosphorus uptake (TotPU), phosphorus uptake efficiency (PUpE), apparent phosphorus fertilizer recovery (APFR), phosphorus use efficiency (PUE) and grain yield (GY) had high positive loading and longer vectors and are thus responsible for large genetic divergence in the PC1. Phosphorus utilization efficiency (PUtE), phosphorus physiological efficiency (PPE), phosphorus agronomic efficiency (PAE) and PUE had high positive loading and longer vectors and are thus responsible for large genetic divergence in the PC2. These traits have much influence (most discriminating power) during selection and can be selected together and thus are more useful as they provide better discriminating information about the genotypes. Grain phosphorus concentration (GrainP), phosphorus harvest index (PHI) and phosphorus efficiency ratio (PER) were the least contributors for the genetic variation (short vectors) and provide little information on the genotypes and, therefore, should not be used as a trait of interest in selecting a genotype.
In the biplot, the cosine of the angle between two traits approximates the correlation between the traits; and hence associations among traits could easily be visualized from the biplot . According to the authors, two traits are positively correlated if the angle between the vectors is acute (90°); negatively correlated if the angle between the vectors is obtuse (>90°) and not correlated if the angle is right angle. Based on this assumption, PUE was positively and significantly correlated to most traits except for its negative correlation with PHI, PER and PUtE. These relationships suggest that it is possible to combine higher yield, higher PUE, higher PUpE, and higher TotPU in a single genotype. The trait relationship observed in the biplot could be witnessed in the correlation results presented in Table 7.
The GT biplot also showed the trait profiles of the genotypes. Genotypes excelling in a particular trait were plotted closer to the vector line and further in the direction of that particular vector, often on the vertices of the convex hull. Accordingly, Hachalu had the highest PUE, GY, TotPU, and PUpE under P-fertilized condition; while Moti had the highest mean performance for the traits under P-fertilized condition. Gebelcho had the second highest PUE, GY, TotPU, and PUpE performance under both P-fertilizer regimes. As shown in Figure 4, the genotypes were found at acute angle to the traits. On the other hand, vectors of genotypes such as EH06022-4, EH06006-6 and Lalo formed obtuse angle with the traits and had below-average performance for the traits.
Based on the traits profile of the genotypes, breeding objectives can easily be determined. For example, higher GY or PUE of the above genotypes can be transferred to the genotypes with lower performance for the two traits but having higher performance for other traits. For instance, the cross between Moti x Lalo will combine higher PUtE of Moti and higher PHI of Lalo.
Table 7. Correlation among PUE traits of faba bean under P fertilized and unfertilized field.

P-

SP

GP

BPU

PHI

PUtE

PUpE

PUE

PAE

PPE

PER

P+

SP

1

0.189

0.722

-0.794

-0.788

0.786

0.388

--

--

--

GP

0.116

1

0.487

-0.107

-0.55

0.473

0.165

--

--

--

BPU

0.76

0.397

1

-0.821

-0.687

0.992

0.797

--

--

--

PHI

-0.796

0.124

-0.721

1

0.75

-0.836

-0.502

--

--

--

PUtE

-0.719

-0.592

-0.65

0.614

1

-0.743

-0.118

--

--

--

PUpE

0.803

0.386

0.988

-0.711

-0.686

1

0.752

--

--

--

PUE

0.407

-0.07

0.742

-0.449

0.017

0.708

1

--

--

--

PAE

0.111

-0.016

0.242

0.154

0.202

0.283

0.53

1

--

--

PPE

-0.196

-0.181

-0.091

0.376

0.467

-0.064

0.309

0.882

1

--

PER

0.015

0.194

0.049

-0.033

-0.093

-0.005

-0.088

-0.37

-0.199

1

APFR

0.61

0.374

0.691

-0.292

-0.468

0.752

0.531

0.619

0.208

-0.365

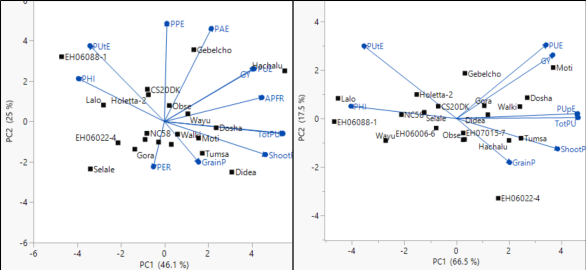
Figure 4. Genotype by trait biplot for the PUE traits of the faba bean genotypes grown with phosphorus fertilizer (left) & without phosphorus fertilizer (right).
4. Discussions
The development of phosphorus (P) efficient crops capable of accessing P reserves in P deficient soils of Sub-Saharan Africa is very important in order to maximize yield and ensure sustainability of crop production. P efficiency can be enhanced by improving P scavenging and uptake (P uptake efficiency) and, more economically, by improving internal P-use efficiency (P utilization efficiency) . In the current study, we assessed genetic variability of faba bean genotypes for P-use efficiency traits at field and greenhouse. The study has found a wide variation of different components of PUE and growth traits in response to contrasting soil P availability (Table 3).
P fertilization level has significantly affected (positively and negatively) the performance of PUE traits; with positive relative reduction (RR) ranging from 13.8% for GY to 38.6% BPU and negative RR ranging from -5.9% for PHI to -305.6% for PUE. A positive RR value shows better performance of the trait under P-fertilized soil (more sensitivity to reduced P); while negative RR value shows better performance under P-unfertilized soil (less sensitivity to reduced P). Comparable RR percentages of the traits to reduced P were reported by . Our study showed that plant P concentrations of the genotypes were higher for P fertilized than unfertilized trial, indicating that P uptake under P fertilized trial is higher than that for P unfertilized trial. Similar studies also reported that higher P fertilization level led to a higher SP and GP values . Yang et al., reported that higher shoot P resulting from increased root P uptake under +P led to a lower PUtE. This finding indicates that using cultivars with lower shoot P% in P-deficient soil is the most efficient approach for increasing PUtE and grain yield, in agreement with findings in potato , faba bean , wheat and sorghum . In accordance with our results, it was also reported that PHI, PUpE, PUtE and PUE were higher under low P than P high soils . Similar to our results, reports indicated that PUtE was significantly lower in high P soil compared to low P soil.
Genotypic variation for P use efficiency has been reported for faba bean and other crop species . This is closely linked to genotypes with efficient and extensive root systems or those with effective associations with mycorrhizal fungi, in order to access a greater soil volume (as P is diffusion limited in most soils) . Our study revealed the availability of genetic variability among the faba bean genotypes for PUE characteristics. In corroboration with our result, Nebiyu et al. reported that faba bean genotypes varied for their shoot and grain P%, BPU and PUE. They also reported similar values of shoot and grain P%, for faba bean, as reported by this study; adding that grain P% of the genotypes was greater than their shoot P%; which is consistent with our findings. The reason for the difference may be supported by the finding of Raboy who indicated that P levels in grains are well above the P levels required for normal cellular function. The author argued that most of the increase in seed P% is synchronous with a decrease in the shoot phosphorus concentration of the senescing leaves and stems. Phosphorus fertilizer management is also mainly driven by the export of P in harvested products . Thus, P concentration is typically much higher in grain than in vegetative material. Our result is also supported by the notion that modern crop varieties use P more efficiently than older varieties (higher PUEy) . Calderini et al. found that PUtE was higher in modern wheat cultivars when compared to older cultivars, owing to the higher harvest indexes of modern wheat cultivars. It has been widely believed that traditional varieties tend to outperform modern varieties for nutrient acquisition under deficient conditions , which would indicate that they were selected under similarly deficient conditions in the pre-Green Revolution era, and that high yielding modern varieties may have lost adaptive traits and genes during the selection under high-input conditions that has been practiced over the past 50 years . Plants tend to have high PUE on soils with low amount of phosphorus, as a means of adaptation mechanism .
It’s also worth mentioning that genotypes with better PUE had higher grain yield. It was also reported by other researchers that Phosphorus use efficient genotype would ideally have higher grain yield . The result of APFR in this study fell within the commonly known range of 10-25% of efficiency of P fertilizer use by plants , which is low due to the strong fixation of phosphate ions by reactive soil components . The study also found out that most phosphorus use efficiency traits were better at field than at greenhouse. It was also reported that binding and curling of roots at the bottom of the pots affected microbial activity and consequently the mobilization and uptake of P in pot experiments. In addition, the effects resulted in differences in performance of the same genotypes under greenhouse and field conditions .
Based on the method suggested by , genotypes were grouped into four efficiency categories: inefficient, non-responder (INR); inefficient, responder (IR); efficient, non-responder (ENR); and efficient, responder (ER). As defined by , INR genotypes give low yield irrespective of nutrient availability; while IR genotypes give low yield when nutrient availability is less, but increases their yield as the nutrient availability increases. ENR genotypes are capable of giving high yield even when nutrient availability is less, but do not respond with increased yield under high input conditions. ER genotypes show high yield at low level of nutrient supply and their yield level increases as nutrient supply increases. Genotypes Moti, Gebelcho, Dosha, Hachalu, Didea, and Holetta-2 fall under ER efficiency class. This is a remarkable result because these genotypes were also better in performance with respect to other traits including grain yield. On the other hand, genotypes such as Selale, Dagim, EH06022-4, EH7015-7 and EH06022-4 are grouped under INR which also corresponded with lower performance of the genotypes for other traits. Furthermore, identification of the genotypes with different efficiency group may implicate the growers to choose genotypes depending on the capacity to use P fertilizer. It’s unquestionable that efficient and responder genotypes are the best candidate for production. However, whenever yield is compromised with ER combination, farmers who can apply adequate amount of phosphorus may be recommended to use genotypes that are responsive to soil fertility and those who can’t afford may choose efficient genotypes. Besides, breeding phosphorus efficient genotypes under phosphorus deficient conditions could be considered as an alternative strategy .
Genotype by trait (GT) biplot can help us understand the relationships among traits (breeding objectives) and help identify traits that are positively or negatively associated, traits that are redundantly measured, and traits that can be used in indirect selection for another trait. It also helps to visualize the trait profiles (strength and weakness) of genotypes, which is important for parent as well as variety selection .
. Our studies showed that Shoot P%, BPU, PUpE, APFR, PUE and GY had high positive loading and longer vectors and are thus responsible for large genetic divergence in the PC1. PUtE, PPE, PAE and PUE had high positive loading and longer vectors and are responsible for large genetic divergence in the PC2. These traits have much influence (most discriminating power) during selection and can be selected together and thus are more useful as they provide better discriminating information about the genotypes. Grain P%, PHI and PER were the least contributors for the genetic variation (short vectors). Hachalu had the highest PUE, GY, BPU, and PUpE under P-fertilized condition; while Moti had the highest mean performance for the traits under P-fertilized condition. Gebelcho had the second highest PUE, GY, BPU, and PUpE performance under both P-fertilizer regimes.
As shown in the biplot figure and correlation analysis, PUE and GY were highly related to PUpE than they were to PUtE. This suggested that PUpE was more critical for GY and PUE variation than PUtE. Similar results were reported in maize , common bean , and wheat . In contrary to our study, PUtE was more critical for GY and PUE variation in wheat , maize and potato . These contrasting conclusions indicate that the contribution of PUpE and PUtE to PUE improvement varies among crops, environments, and soil P availabilities. In corroboration with the present study, previous reports by in potato and in faba bean and indicated significant positive correlation of PUE with total biomass and grain yield. Similar to our results, other studies also reported that PUpE was well correlated to yield .
5. Conclusion
The study found out that the faba bean genotypes were significantly different for most of the measured PUE traits and there was no consistent superiority of a genotype across all study conditions. However, Gebelcho, Moti, Hachalu and Dosha were found to be phosphorus use efficient genotypes. Furthermore, it was found that the difference in P use efficiency was largely due to differences in P uptake efficiency and grain yield performance. Generally, the study revealed that most of the genotypes with good phosphorus efficiency classes were also the best performing ones for other traits; which is an added selection criterion to include these genotypes in breeding programmes. Hence, in order to incorporate these genotypes in further improvement programmes of the crop; they should undergo additional field and greenhouse trials. The study’s overall findings could be applied to the enhancement of genotypes with P efficiency, which will increase P uptake and utilization particularly on phosphorus deficient soils of faba bean growing regions of Ethiopia.
Abbreviations

FAO

Food and Agriculture Organization of the United Nations

PC

Principal Component

PUE

Phosphorus Use Efficiency

SAS

Statistical Analysis Software

Acknowledgements
The authors would like to thank Pan African Union for funding the research. Ethiopian Institute of Agricultural Research and Addis Ababa University are duly acknowledged for providing experimental materials and technical support.
Conflict of Interests
The authors declare no conflicts of interest.
References
[1] FAOSTAT. (2022). Food and Agriculture Organization of the United Nations.
[2] Crépon K, Marget P, Peyronnet C, Carrouée B, Arese P, Duc G (2010). Nutritional value of faba bean (Vicia faba L.) seeds for feed and food. J. Field Crops Res. 115: 329-339.
[3] Tiessen H (2008). Phosphorus in the Global Environment. In: White, P. J. and Hammond, J. P. (eds.), The Ecophysiology of Plant-Phosphorus Interactions. Springer, the Netherlands.
[4] Fageria NK (2009). The use of nutrients in crop plants. Taylor and Francis, New York, USA.
[5] Mesfin A (1998). Nature and Management of Ethiopian Soils. Alamaya University of Agriculture. Alemaya, Ethiopia.
[6] Lynch, J. P. (2011) Root phenes for enhanced soil exploration and phosphorus acquisition: tools for future crops, Plant Physiol. 156(2011) 1041-1049.
[7] El Mazlouzi, M., Morel, C., Chesseron, C., Robert, T., and Mollier, A. (2020). Contribution of External and Internal Phosphorus Sources to Grain P Loading in Durum Wheat (Triticum durum L.) Grown Under Contrasting P Levels. Front. Plant Sci. 11: 870.
[8] Kirkby EA, Johnston AE (2008). Soil and Fertilizer Phosphorus in Relation to Crop Nutrition. In White, P. J., Hammond, J. P. (eds.): The Ecophysiology of Plant-Phosphorus Interaction. Springer Science, Amsterdam, The Netherlands, pp. 177-223.
[9] Katungi E, Farrow A, Mutuoki T, Gebeyehu S, Karanja D, Fistum A, Sperling L, Beebe S, Rubyogo JC, Buruchara R (2010). Improving common bean productivity: An Analysis of socioeconomic factors in Ethiopia and Eastern Kenya. Baseline Report Tropical legumes II. Centro Internacional de Agricultura Tropical - CIAT. Cali, Colombia.
[10] Syers J, Johnston A, Curtin D (2008). Efficiency of Soil and Fertilizer Phosphorus Use: Reconciling Changing Concepts of Soil Phosphorus Behavior with Agronomic Information. FAO Fertilizer and Plant Nutrition Bulletin 18. FAO, Rome, Italy.
[11] Bovill WD., Chun YH, and Glenn KM (2013). Genetic approaches to enhancing phosphorus-use efficiency (PUE) in crops: challenges and directions. Crop & Past. Sci., 64, 179-198.
[12] Belachew, K. Y.; Maina, N. H.; Dersseh, W. M.; Zeleke, B.; Stoddard, F. L. Yield Gaps of Major Cereal and Grain Legume Crops in Ethiopia: A Review. Agronomy 2022, 12, 2528.
[13] Vance CP, Uhde-Stone C Allan DL (2003). Phosphorus acquisition and use: critical adaptations by plants for securing a nonrenewable resource. New Phytologist 157: 423-447.
[14] McBeath TM, Armstrong RD, Lombi E, McLaughlin MJ, Holloway RE (2005). Responsiveness of wheat (Triticum aestivum) to liquid and granular phosphorus fertilizers in southern Australian soils. Australian Journal of Soil Research 43: 203-212.
[15] Cordell, D., Drangert JO, White S (2009). The story of phosphorus: Global food security and food for thought. Glob. Environ. Change 19: 292-305.
[16] Rose TJ, Rose MT, Pariasca-Tanaka J, Heuer S, Wissuwa M (2011). The frustration with utilization: Why have improvements in internal phosphorus utilization efficiency in crops remained so elusive? Front Plant Sci. 2.
[17] Rose TJ, Wissuwa M (2012): Rethinking internal phosphorus utilization efficiency: A new approach is needed to improve PUE in grain crops. Adv. Agron. 116, 185-217.
[18] Belane AK, Dakora FD (2010). Symbiotic N2 fixation in 30 field-grown cowpea (Vigna unguiculata L. Walp.) genotypes in the Upper West Region of Ghana measured using 15N natural abundance. Biol. Fert. Soils 46: 191-198.
[19] Fairhurst T, Lefroy R, Mutret E, Batjes N (1999). The importance, distribution and causes of Phosphorus deficiency as a constraint to crop production in the tropics. Agrofor. 9(4): 2-8.
[20] Bilal, H. M.; Aziz, T.; Maqsood, M. A.; Farooq, M.; Yan, G. Categorization of wheat genotypes for phosphorus efficiency. PLoS ONE 2018, 13, e0205471.
[21] Sandaña, P. Phosphorus uptake and utilization efficiency in response to potato genotype and phosphorus availability. Eur. J. Agron. 2016, 76, 95-106.
[22] Rahim, A.; Ranjha, A. M.; Waraich, E. A. Effect of phosphorus application and irrigation scheduling on wheat yield and phosphorus use efficiency. Soil Environ. 2010, 29, 15-22.
[23] Aziz, T.; Finnegan, P. M.; Lambers, H.; Jost, R. Organ-specific phosphorus-allocation patterns and transcript profiles linked to phosphorus efficiency in two contrasting wheat genotypes. Plant Cell Environ. 2014, 37, 943-960.
[24] Daoui K, Karrou M,. Mrabet R, Fatemi Z, Draye X, JF Ledent JF (2012). Genotypic Variation of Phosphorus Use Efficiency Among Moroccan Faba Bean Varieties (Vicia faba Major) Under Rainfed Conditions. Journal of Plant Nutrition. Volume 35, Issue 1.
[25] Nebiyu A, Jan D, Pascal B (2016). Phosphorus use efficiency of improved faba bean (Vicia faba) varieties in low-input agro-ecosystems. J. Plant Nutr. Soil Sci. 2016, 000, 1-8.
[26] Dereje S, Nigussie D, Setegn G, Eyasu E (2016). Phosphorus use Efficiency of Common Bean (Phaseolus vulgaris L.) and Response of the Crop to the Application of Phosphorus, Lime, and Compost in Boloso Sore and Sodo Zuria Districts, Southern Ethiopia. PhD Dissertation.
[27] Rose, T., Liu, L., and Wissuwa, M. (2013). Improving phosphorus efficiency in cereal crops: Is breeding for reduced grain phosphorus concentration part of the solution? Front. Plant Sci. 4, 444.
[28] Wang, F., Rose, T., Jeong, K., Kretzschmar, T., and Wissuwa, M. (2016). The knowns and unknowns of phosphorus loading into grains, and implications for phosphorus efficiency in cropping systems. J. Exp. Bot. 67, 1221-1229.
[29] Sahelemedihin S, Taye B (2000). Procedures for soil and plant analysis. National Soil Research Center, Ethiopian Agricultural Research Organization, Addis Ababa, Ethiopia.
[30] Johnston AE, Syers JK (2009). A new approach to assessing phosphorus use efficiency in agriculture. Better crops 93, 14-16.
[31] Cleemput OV, Zapata F, Vanlauwe B (2008). Use of tracer technology in mineral fertilizer management. In: Guidelines on Nitrogen Management in Agricultural Systems. International Atomic Energy Agency, Austria, Vienna, pp. 19-126.
[32] Parentoni, S. N. and C. L. D. Souza Júnior (2008) Phosphorus acquisition and internal utilization efficiency in tropical maize genotypes Pesqui. Agropecu. Bras., 43(2008), pp. 893-901.
[33] Ajay B. C., Singh A. L., Narendra Kumar, Dagla M. C., Bera S. K. and Abdul Fiyaz R. 2015. Role of phosphorus efficient genotypes in increasing crop production. In: Recent Advances in Crop Physiology (ed. A. L. Singh), Astral International, New Delhi, Vol.
[34] Ozturk, L., Eker, S., Torun, B., and Cakmak, I. (2005) Variation in phosphorus efficiency among 73 bread and durum wheat genotypes grown in a phosphorus-deficient calcareous soil. Plant Soil, 269, 69-80.
[35] Gerloff, S. (1977). Plant efficiencies in the use of N, P and K. In: Plant Adaptation to Mineral Stress in Problem Soils, pp. 161-174, (Wright, M. J., ed). Cornell Univ. Press: New York.
[36] Gunes, A. I., Alpaslan, M. and Cakmak, I. (2006). Genotypic variation in phosphorus efficiency between wheat cultivars grown under greenhouse and field conditions. Soil Science and Plant Nutrition 52:
[37] Gemechu K., Endashaw B., Muhammad I., Fassil A., Emana G. and Kifle D., (2012). Genetic potential and limitations of Ethiopian chickpea (Cicer arietinum l) germplasm for improving attributes of symbiotic nitrogen fixation, phosphorus uptake and use efficiency, and adzuki bean beetle (Callosobrucus chinensis l.) resistance. PhD Dissertation.
[38] SAS Institute. (2012). SAS/STAT User guide. SAS Institute Inc. Cary, NC, USA.
[39] Yan, W. and Frégeau-Reid, J. (2018). Genotype by Yield by Trait (GYT) Biplot: a Novel Approach for Genotype Selection based on Multiple Traits. Scientific Reports; 8: 8242.
[40] Yan, W. and Tinker, N. A. (2006). Biplot Analysis of Multi-Environment Trial Data: Principles and Applications. Can. Jour. of Pla. Sci. 86(3): 623-645.
[41] Veneklaas, E. J., Lambers, H., Bragg, J., Finnegan, P. M., Lovelock, C. E., Plaxton, W. C., et al. (2012). Opportunities for improving phosphorus-use efficiency in crop plants. New Phytol. 195, 306-320.
[42] Gemechu, K., Endashaw B., Fassil A., Muhammad, I., Tolessa D., Kifle D., and Emana G. (2015) Characterization of Ethiopian chickpea (Cicer arietinum L.) germplasm accessions for phosphorus uptake and use efficiency I. Performance evaluation. Ethiop. J. Appl. Sci. Technol. Vol. 6(2): 53-76.
[43] Yang, H., Chen, R., Chen, Y., Han Li, Ting Wei, Wei Xie, Gaoqiong Fa (2022) Agronomic and physiological traits associated with genetic improvement of phosphorus use efficiency of wheat grown in a purple lithomorphic soil. The Crop Journal 10(2022) 1151-1164.
[44] Higo M, Azuma M, Kamiyoshihara Y, Kanda A, Tatewaki Y and Isobe K. 2020. Impact of phosphorus fertilization on tomato growth and arbuscular mycorrhizal fungal communities. Microorganisms 8(2): 178.
[45] Leiser W, Rattunde HFW, Weltzien E, Haussmann BIG (2014). Phosphorus uptake and use efficiency of diverse West and Central African sorghum genotypes under field conditions in Mali. Plant Soil 377, 383-394.
[46] Deng, Y., Teng, W., Tong, Y. P., Chen, X. P., and Zou, C. Q. (2018). Phosphorus efficiency mechanisms of two wheat cultivars as affected by a range of phosphorus levels in the field. Front. Plant Sci. 9, 1614.
[47] Raboy V (2009), Approaches and challenges to engineering seed phytate and total phosphorus. Plant Sci. 177, 281-296.
[48] Calderini DF, Torres-León S, Slafer GA (1995). Consequences of wheat breeding on nitrogen and phosphorus yield, grain nitrogen and phosphorus concentration and associated traits. Ann. Bot. 76, 315-322.
[49] Wissuwa M, Mazzola M, Picard C (2009). Novel approaches in plant breeding for rhizosphere-related traits. Plant and Soil 321, 409-430.
[50] Fei L, Junguo L, Philippe C, Thomas N, Jinfeng C, Rong W, Daniel G, Jordi S, Josep P, Michael O (2018). Global and regional phosphorus budgets in agricultural systems and their implications for phosphorus-use efficiency. Earth Syst. Sci. Data 10, 1-18.
[51] Lindsay WL (1979). Chemical Equilibrium in Soils (Wiley: New York).
[52] Sample EC, Soper RJ, Racz GJ (1980) Reactions of phosphate fertilizers in soils. In ‘The Role of Phosphorus in Agriculture’. (Eds. FE Khasawneh, EJ Sample, EJ Kamprath), pp. 263-310.
[53] Beebe, S. E., M. Rojas-Pierce, X. Yan, M. W. Blair, F. Pedraza, F. Muñoz, J. Tohme, J. P. Lynch, (2006) Quantitative trait loci for root architecture traits correlated with phosphorus acquisition in common bean. Crop Sci., 46(2006), pp. 413-423.
[54] Osborne, L. D. and Z. Rengel (2002) Screening cereals for genotypic variation in efficiency of phosphorus uptake and utilization. Crop Pasture Sci., 53(2002), p. 295.
[55] Corrales, I., Amenós, M., C. Poschenrieder, J. Barceló, (2007) Phosphorus efficiency and root exudates in two contrasting tropical maize varieties. J. Plant Nutr., 30(2007), pp. 887-900.
[56] Balemi, T. and M. K. Schenk (2009) Genotypic difference of potato in carbon budgeting as a mechanism of phosphorus utilization efficiency. Plant Soil, 322(2009), pp. 91-99.
[57] Vandamme, E., Rose, T. J., Saito, K., Jeong, K., and Wissuwa, M. (2016). Integration of P acquisition efficiency, P utilization efficiency and low grain P concentration into P efficient rice genotypes for specific target environments. Nutr. Cycling Agroecosyst. 104, 413-427.
[58] Henry A, Chaves NF, Kleinman PJA, Lynch JP. (2010a) Will nutrient-efficient genotypes mine the soil? Effects of genetic differences in root architecture in common bean (Phaseolus vulgaris L.) on soil phosphorus depletion in a low-input agro-ecosystem in Central America. Field Crops Res 115: 67-78.
Cite This Article
  • APA Style

    Abu, G., Adetimirin, V., Fatokun, C., Keneni, G., Assefa, F. (2025). Genotypic Variation for Phosphorus-use Efficiency Characteristics in Faba Bean (Vicia faba L.). Plant, 13(3), 108-123. https://doi.org/10.11648/j.plant.20251303.11

    Copy | Download

    ACS Style

    Abu, G.; Adetimirin, V.; Fatokun, C.; Keneni, G.; Assefa, F. Genotypic Variation for Phosphorus-use Efficiency Characteristics in Faba Bean (Vicia faba L.). Plant. 2025, 13(3), 108-123. doi: 10.11648/j.plant.20251303.11

    Copy | Download

    AMA Style

    Abu G, Adetimirin V, Fatokun C, Keneni G, Assefa F. Genotypic Variation for Phosphorus-use Efficiency Characteristics in Faba Bean (Vicia faba L.). Plant. 2025;13(3):108-123. doi: 10.11648/j.plant.20251303.11

    Copy | Download

  • @article{10.11648/j.plant.20251303.11,
      author = {Gemechu Abu and Victor Adetimirin and Christian Fatokun and Gemechu Keneni and Fassil Assefa},
      title = {Genotypic Variation for Phosphorus-use Efficiency Characteristics in Faba Bean (Vicia faba L.)
    },
      journal = {Plant},
      volume = {13},
      number = {3},
      pages = {108-123},
      doi = {10.11648/j.plant.20251303.11},
      url = {https://doi.org/10.11648/j.plant.20251303.11},
      eprint = {https://article.sciencepublishinggroup.com/pdf/10.11648.j.plant.20251303.11},
      abstract = {Developing phosphorus-use efficient faba bean (Vicia faba L.) genotypes is crucial for ensuring sustainable production in low phosphorus soils. The present study was conducted with the objective of identifying faba bean genotypes that use P efficiently. Twenty genotypes of faba bean in the field and 12 genotypes in the greenhouse were planted under two P fertilizer regimes (0 and recommended, 46 kg/ha). Withholding P fertilizer (0 kg/ha) application has significantly affected the performance of PUE traits; with decreasing effect ranging from 13.8% for grain yield (GY) to 38.6% for biomass phosphorus uptake (BPU) and increasing effect ranging from 5.9% for phosphorus harvest index (PHI) to 305.6% for PUE. Difference among the genotypes for most PUE traits were highly significant (P<0.01) under both P fertilizer regimes. Genotypes Moti, Gebelcho, and CS20DK in the field; Hachalu, Gebelcho and Dosha in the greenhouse, were efficient responder (ER) and had statistically higher mean for most PUE traits. Most traits including PUE had moderately high (60-79%) heritability. Biplot analysis showed that PUE, GY, BPU, and PUpE contributed the highest genetic divergence indicating their importance in breeding. Correlation analysis revealed that PUE was positively correlated to most traits including GY. It was shown that PUE and GY were strongly correlated to PUpE than they were to PUtE; suggesting that PUpE was more critical than PUtE for PUE variation. Findings of the study could be used to screen genotypes which have higher PUE and use them for breeding new cultivars better adapted to low P status soils.
    },
     year = {2025}
    }
    

    Copy | Download

  • TY  - JOUR
    T1  - Genotypic Variation for Phosphorus-use Efficiency Characteristics in Faba Bean (Vicia faba L.)
    
    AU  - Gemechu Abu
    AU  - Victor Adetimirin
    AU  - Christian Fatokun
    AU  - Gemechu Keneni
    AU  - Fassil Assefa
    Y1  - 2025/06/30
    PY  - 2025
    N1  - https://doi.org/10.11648/j.plant.20251303.11
    DO  - 10.11648/j.plant.20251303.11
    T2  - Plant
    JF  - Plant
    JO  - Plant
    SP  - 108
    EP  - 123
    PB  - Science Publishing Group
    SN  - 2331-0677
    UR  - https://doi.org/10.11648/j.plant.20251303.11
    AB  - Developing phosphorus-use efficient faba bean (Vicia faba L.) genotypes is crucial for ensuring sustainable production in low phosphorus soils. The present study was conducted with the objective of identifying faba bean genotypes that use P efficiently. Twenty genotypes of faba bean in the field and 12 genotypes in the greenhouse were planted under two P fertilizer regimes (0 and recommended, 46 kg/ha). Withholding P fertilizer (0 kg/ha) application has significantly affected the performance of PUE traits; with decreasing effect ranging from 13.8% for grain yield (GY) to 38.6% for biomass phosphorus uptake (BPU) and increasing effect ranging from 5.9% for phosphorus harvest index (PHI) to 305.6% for PUE. Difference among the genotypes for most PUE traits were highly significant (P<0.01) under both P fertilizer regimes. Genotypes Moti, Gebelcho, and CS20DK in the field; Hachalu, Gebelcho and Dosha in the greenhouse, were efficient responder (ER) and had statistically higher mean for most PUE traits. Most traits including PUE had moderately high (60-79%) heritability. Biplot analysis showed that PUE, GY, BPU, and PUpE contributed the highest genetic divergence indicating their importance in breeding. Correlation analysis revealed that PUE was positively correlated to most traits including GY. It was shown that PUE and GY were strongly correlated to PUpE than they were to PUtE; suggesting that PUpE was more critical than PUtE for PUE variation. Findings of the study could be used to screen genotypes which have higher PUE and use them for breeding new cultivars better adapted to low P status soils.
    
    VL  - 13
    IS  - 3
    ER  - 

    Copy | Download

Author Information
  • Abstract
  • Keywords
  • Document Sections

    1. 1. Introduction
    2. 2. Materials and Methods
    3. 3. Results
    4. 4. Discussions
    5. 5. Conclusion
    Show Full Outline
  • Abbreviations
  • Acknowledgements
  • Conflict of Interests
  • References
  • Cite This Article
  • Author Information